
Andrew Leigh's inequality slip-up
Australia’s new Assistant Minister for Productivity, Competition, Charities and Treasury—Andrew Leigh—is undoubtedly an excellent economist, even if he does tend to make the odd mistake. Australia would certainly be a better country if we had a dozen more like him in Canberra!
But unfortunately, Leigh appears to have erred earlier this week, which could lead to unfortunate consequences if the policy implications are acted upon by the Albanese government.
Here’s Leigh, who was quoted by The Guardian on inequality:
“While growing the economic pie is critical, Leigh is equally focused on how the dividends of reform are distributed. He says the income share of Australia’s affluent class – the top 1% – has nearly doubled since 1980, from 5% to 8%, while in the US it has increased from 10% to 21%.
‘So we’re now as unequal as the US was in 1980,’ he says. ‘Track that [trend] through another generation and suddenly … things start to look much much more like US-style inequality’.”
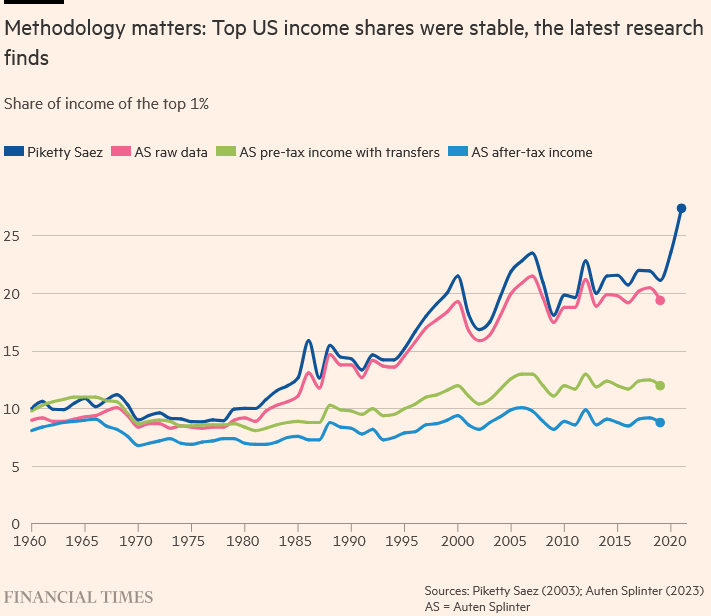
I’m relatively familiar with the inequality data, and so this claim immediately jumped out at me. The only way to get an inequality figure of 21% for the US is if you’re using Piketty and Saez (2019) without adjusting for taxes and transfers. The Financial Times showed this in a good chart on the various methodologies a couple of years ago (note that the 2020-21 jump is due to the pandemic):
Basically, the top 1% have indeed been earning more of the income share—21.1% in 2019 using Piketty and Saez, or 19.4% using the more recent methodology of Auten and Splinter (AS)—but the tax and transfer system has done a good job at levelling it out to something close to the 60-year average.
But what about Australia? Unfortunately the data aren’t as good; the ABS produces an irregular series on personal income broken down by distribution, but it’s only gross income—that is, pre-tax. It showed that in 2021-22 (a year distorted by the pandemic), the top 1% of earners in Australia collected a 10.3% share of income.
But even that makes me question Leigh’s 8% figure—does Australia’s globally-high reliance on income taxes really only shave only two percentage points off the top 1%’s income share? These people are paying a 45% marginal tax rate, after all.
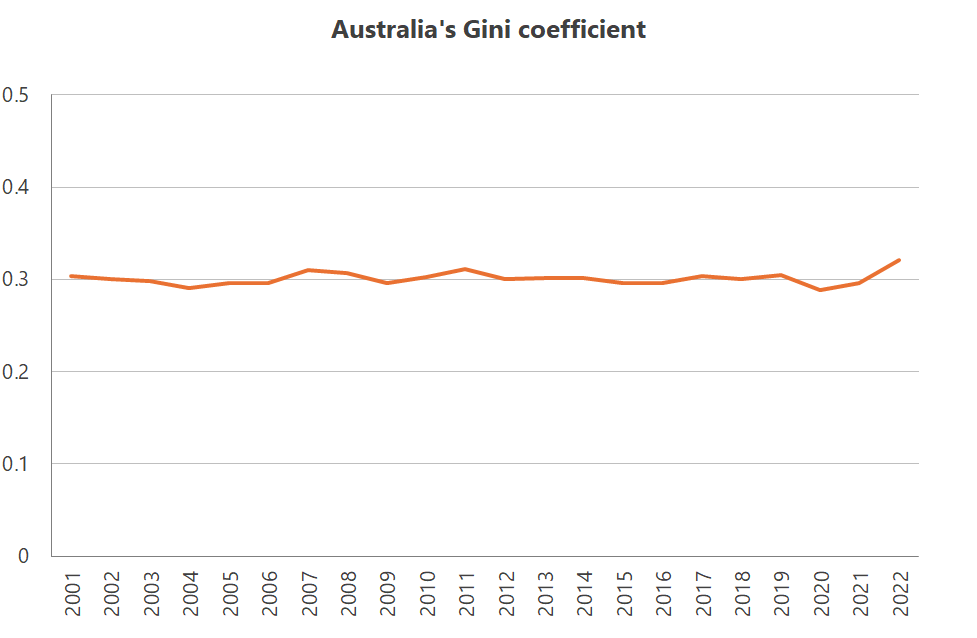
So, I decided to check another source: the 2024 Household, Income and Labour Dynamics in Australia (HILDA) survey. HILDA might not have anything about the income shares of the top 1%, but it does have a Gini co-efficient, which measures inequality amongst all households (not individuals) in a range from zero to one. A Gini coefficient of one is the equivalent of a single household having all the income, so if inequality is what you’re worried about you’ll want to see this measure closer to zero.
Australia remains relatively equal by global standards and has been broadly unchanged for two decades, even if the most recent survey year saw a small up-tick, making it the most unequal ever in the HILDA survey period.
That up-tick was largely because of the post-pandemic inflation combined with the withdrawal of handouts that were distributed in the prior two years, which the University of Melbourne said led to “growth in high incomes relative to middle incomes (as reflected by the ratio of the 90th percentile to the median) and declines in low incomes relative to middle incomes”.
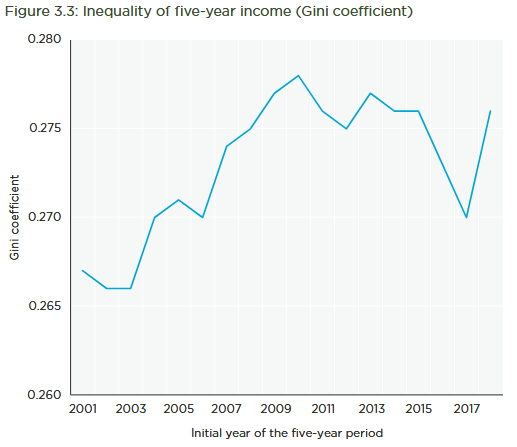
Fortunately HILDA is a longitudinal survey, so we can also look at inequality over five-year intervals. Here’s the University of Melbourne again:
“The Gini coefficient for five-year income increased by approximately 4.5% between 2002–2006 and 2010–2014, then declined slightly to 2015-2019, dropped sharply to 2017–2021 and then rebounded even more sharply in 2018–2022. The fluctuations in inequality of five-year income after 2015–2019 can be attributed to the effects of the COVID-19 pandemic. However, the fluctuations prior to the pandemic stand in contrast to the finding of little change in inequality of one-year income. This reflects the fact that inequality of five-year income is affected by the extent to which people move up and down the income distribution from one year to the next. The greater is mobility in incomes, the lower will be five-year income inequality relative to one-year income inequality.”
When they controlled for people moving up and down the income distribution by looking only at specific birth cohorts over a period of 22 years, the Gini coefficient fell to an average of just 0.236—i.e. below any of the measures above. Why? Because “inequality attributable to different lifecycle stages is largely eliminated when examining specific birth cohorts”.
In fact, the group of people aged 35 to 44 in 2001 had a higher Gini coefficient (0.226) than people aged 25 to 34 in 2001 (0.212) suggesting that if anything, income inequality may have declined in Australia over the last couple of decades—i.e. directionally opposite to the assertion made by Leigh.
Now, none of this is to suggest that we shouldn’t be thinking about income inequality—especially if it’s growing along with ills like poverty and homelessness, which could mean that the rich are growing richer at the expense of the poor, rather than along with them.
But Leigh’s misreading of the income inequality data means he’s at risk of misdiagnosing the underlying problems. If this were Chris Bowen, I wouldn’t be so worried; he seems to spout nonsense on a daily basis, and everyone knows it. Indeed, it’s precisely because of Leigh’s background as an economist and the high regard with which people hold his views that it’s critically important he gets his facts right, lest he leads his party astray.
Alas, in this case—perhaps because he has now been in government for 15 years—Leigh doesn’t appear to have kept up with the latest data or academic research in the inequality space. I only hope that doesn’t translate into bad policy.
Comments
Comments have been disabled and we're not sure if we'll ever turn them back on. If you have something you would like to contribute, please send Justin an email or hit up social media!